When it comes to measuring the success of energy markets, one metric often gets the most attention: price per kilowatt-hour (kWh) of electricity. On the surface, this simple way of comparing prices might seem like the best way to compare state electricity market success. But in reality, focusing solely on this number paints an incomplete picture.
True market success goes beyond just the price per kWh because the price per kWh represents a bundled cost of one unit of electricity consumed. That cost incorporates fees, taxes, and distribution charges that are unique to each state and utility. It also doesn’t weigh a state’s access to different generation assets, which can easily alter the price.
Context is needed when comparing raw data from state to state. Without it, the price rankings often reported on in news stories leave consumers with apples-to-oranges comparisons.
Price per kWh is a snapshot of cost at a specific time and day, rather than an overall consumer value. It doesn’t account for the factors that drive long-term performance, resilience, or innovation the way that price performance does.
Price performance looks at how well a market delivers value relative to cost over time, which is missing when only considering price per kWh.
States also cannot be equally compared just on price because no two states are the same. Consumers’ electric bills are comprised of a variety of different charges, many of which are directed by the state legislature.
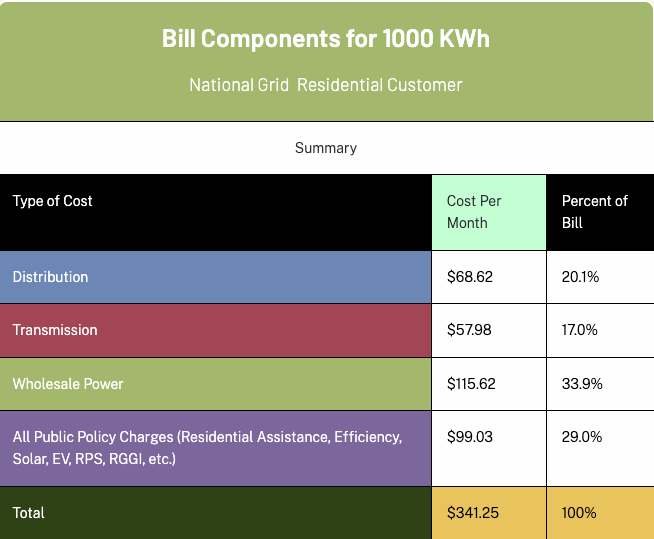
Massachusetts is a state that demonstrates the difficulty in comparing prices to other states. The average residential electricity rate for Bay-Staters is just north of 30¢/kWh, ranking Massachusetts as the state with the third-highest average rate. According to WhatsInMyElectricBill.com, nearly 30% of a Massachusetts electric bill is public policy charges: residential assistance programs, energy efficiency, and renewable energy requirements. About 40% of the bill is the average distribution and transmission charge across the two main utilities. That leaves only about 30% of the bill for the actual cost of the electricity purchased and used.
By comparison, Idaho ranks number one for the best rate at less than half of Massachusetts’. Consumers in Idaho are required to pay for energy efficiency charges and even the closure of a coal plant; but the actual cost of the electric source is tiered into pricing levels for Idahoans based on energy usage and the time of year they are using it.
Each state legislature and investor-owned utility has its own policy beliefs and priorities, which create differences among state electric bills.
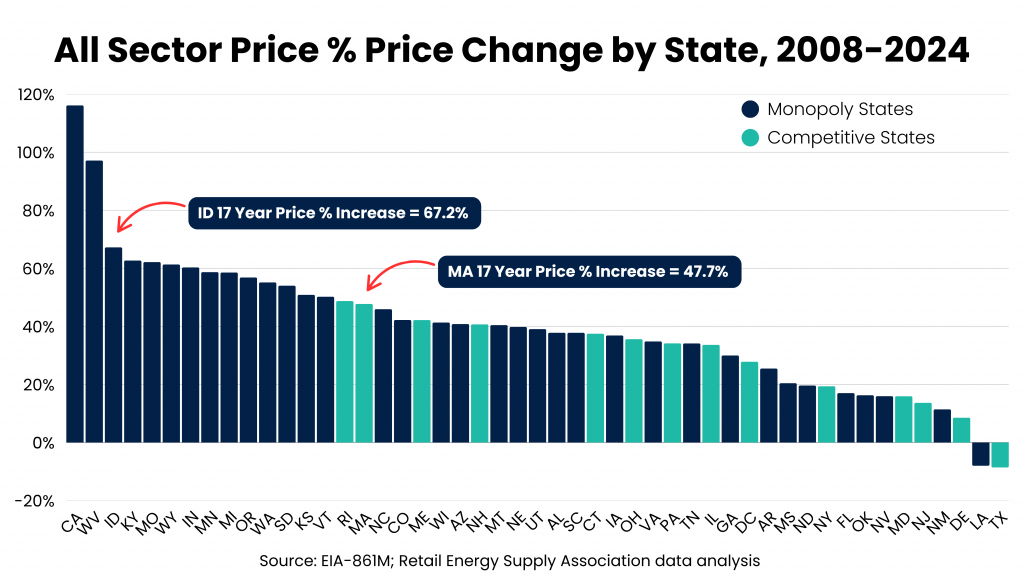
The often untold story on price is when states are compared based on price performance. When factoring in all consumer classes, Idaho actually ranks third worst among all states for its change in electricity price from 2008-2024. During that time, Idaho’s average electric price increased by more than 67%. Massachusetts ranked about 15 states better with a price change over the same time of less than 50%.
When comparing state prices based on performance over time, a factor that should be considered is whether the state operates under a monopoly market run by investor-owned utilities or if the state has restructured the electric market in any way to welcome competition.
Pennsylvania leaders voted to restructure the state’s energy market in 1996. Competition in power generation and electric supply has provided consumers with more affordable electricity options, including products at a lower price than electricity sold in 1996. But more importantly for all consumers in Pennsylvania, competition has applied downward price pressure on the utilities –– which still sell electricity –– keeping all prices more affordable. In fact, Pennsylvania consumers who were still receiving their electricity from their utility in 2024 were saving about 20% on their electric supply compared to what the rate would have been when an inflation adjustment is applied to the 1996 rate. This is a demonstration of downward price pressure because competition is present, preventing monopoly utilities from charging uncontested rates.
The effect of competition and downward price pressure can be found in all consumer class electricity prices. When comparing all monopoly utility states to competitive states, non-residential (industrial and commercial) electric prices increased by nearly 40% between 2008-2024 in monopoly states. In contrast, electric prices for that same consumer class slightly decreased by .3%.
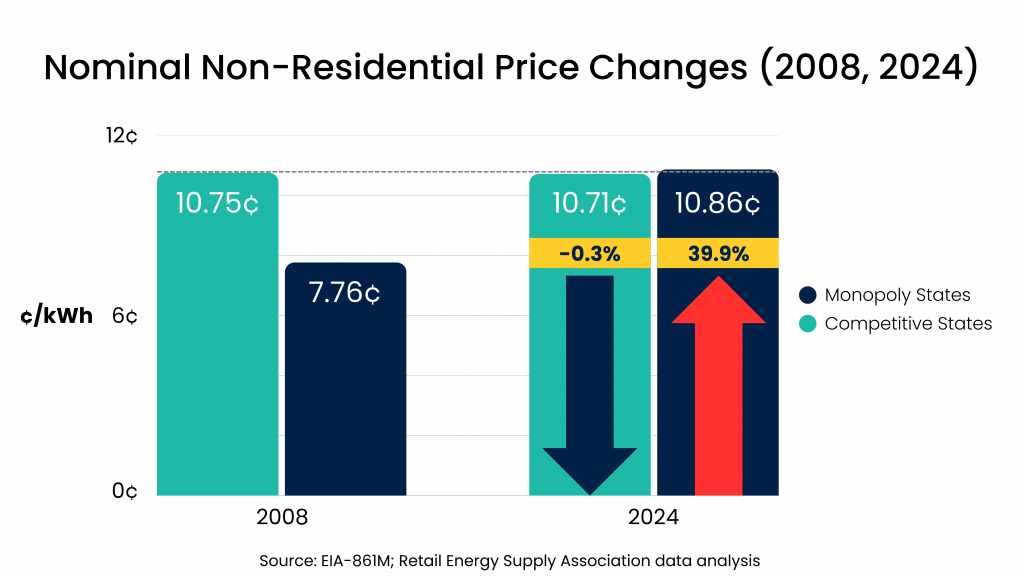
In looking at the price performance over time, not only did monopoly states prices increase significantly over time, but the average price for monopoly states also surpassed the average price for competitive states –– which decreased over time.
When attempting to compare electricity prices, it helps to understand what makes up the price that’s being compared, and just as important, how prices have performed over time in the states that are being compared. In the end, price per kWh only scratches the surface of what defines market success. Price performance gives a better picture by measuring long-term consumer value.
